.png)
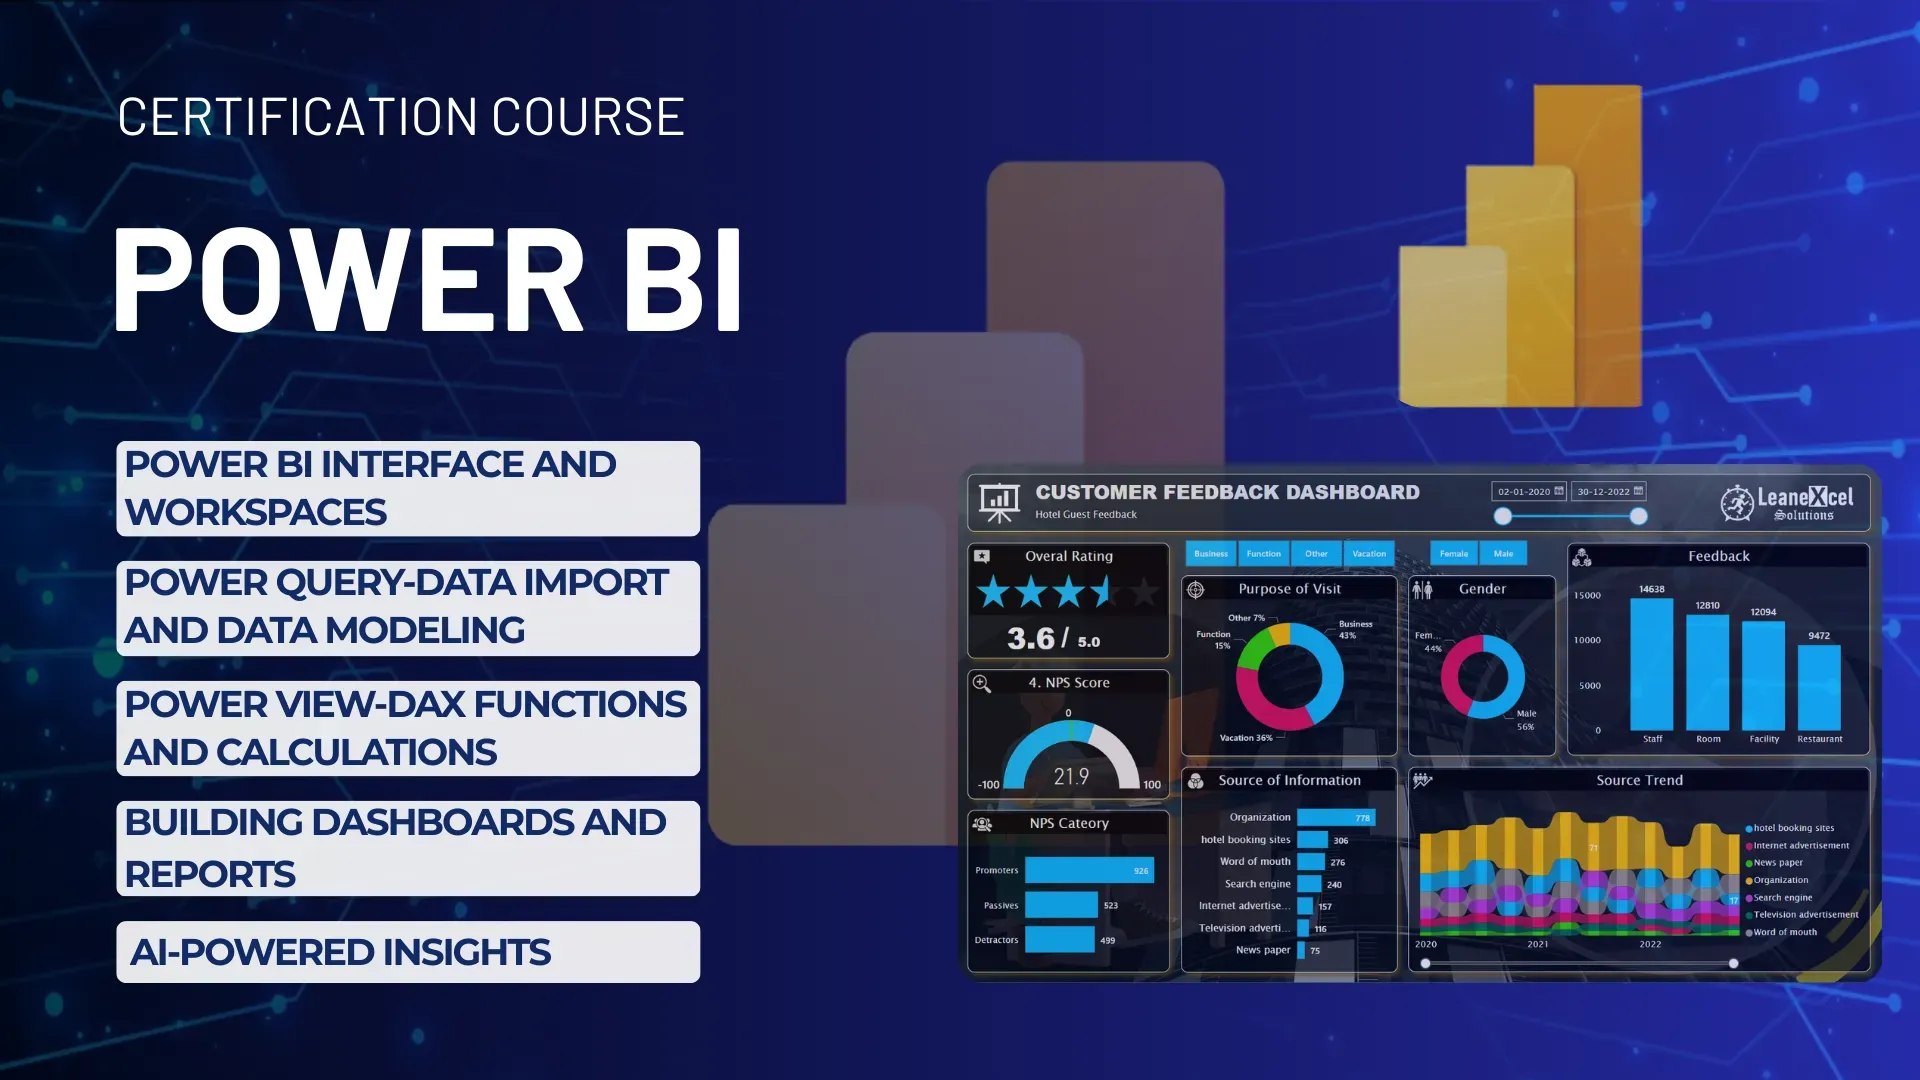
Online 2 hours sessions Every Saturday and Sunday
Offline 1.5 hours sessions 5 days a week from Monday to Friday
📊 Power BI Training in Indore at Cypher Analytica
Master Data Visualization & Business Intelligence with Microsoft Power BI
Power BI is Microsoft’s leading business intelligence tool used by analysts and decision-makers worldwide. It transforms raw data into compelling insights through stunning dashboards and interactive reports.
🎯 Course Objective: Enable learners in Indore to harness the full potential of Power BI for real-time analytics, data transformation, and storytelling – without writing complex code.
✅ 1. Power BI Overview /
What is Power BI and why it matters in today’s data-driven world
Understanding the Power BI ecosystem: Desktop, Service, Mobile
Installation, UI walkthrough, and building your first report
✅ 2. Data Connection & Power Queryn
Connect Power BI to Excel, SQL, Web, and cloud-based sources
Clean, transform, and prepare data with Power Query Editor
Merge, append, remove duplicates, pivot/unpivot data
✅ 3. Data Modeling /
Create relationships between tables (one-to-many, many-to-one)
Build efficient data models using star/snowflake schemas
Create calculated tables and hierarchies
✅ 4. DAX – Data Analysis Expressions/
Use DAX to create calculated columns, measures, KPIs
Master functions like CALCULATE, FILTER, SUMX, SWITCH
Perform time intelligence (YTD, MTD, QoQ comparisons)
✅ 5. Data Visualization & UI Design
Build interactive dashboards with charts, cards, maps, slicers
Customize visuals: conditional formatting, tooltips, bookmarks
Design best practices: alignment, themes, storytelling
✅ 6. Interactive Dashboards & Reports /
Add interactivity: drill-down, drill-through, sync slicers
Implement page navigation and custom tooltips
Create report-level and visual-level filters
✅ Power BI Service & Collaboration/
Publish reports to Power BI Service
Share dashboards, manage workspaces, set permissions
Schedule automatic data refreshes and monitor performance
✅ 8. Excel & Power Platform Integration/
Import Excel pivot models into Power BI
Export visuals to Excel, PDF, PowerPoint
Intro to Power Automate and Power Apps integration
✅ 9. Real-World Capstone Projects /
Sales Performance Dashboard
HR & Workforce Analytics
Finance & Budgeting Dashboard
Customer Segmentation & Behavior Analysis
Domain use cases in Retail, Healthcare, Banking, Marketing
Who Should Join Cypher Analytica Data Analytics Course?
BBA, BCA, BCom, BA, BSc, MBA, MCA students looking to start a career in Data Analytics.
Working professionals seeking to upgrade skills in data-driven decision-making.
Freshers eager to enter the booming field of Data Analytics.
Data enthusiasts who want to turn data into actionable insights.
Why Choose Cypher Analytica Over Other Institutes?
Industry-Leading Curriculum
20+ years Experience corporate trainer
Flexible Learning Options
Affordable with Flexible Payment Plans
Live Projects & Hands-on Experience
Recorded Videos & Study Material
Industry-Relevant Certifications
Resume Building & Interview preparation
100% Placement Support